Kai Schmidt · 8 October 2026
Satellite Data Meets Lab Records in Vegetation Timing Studies
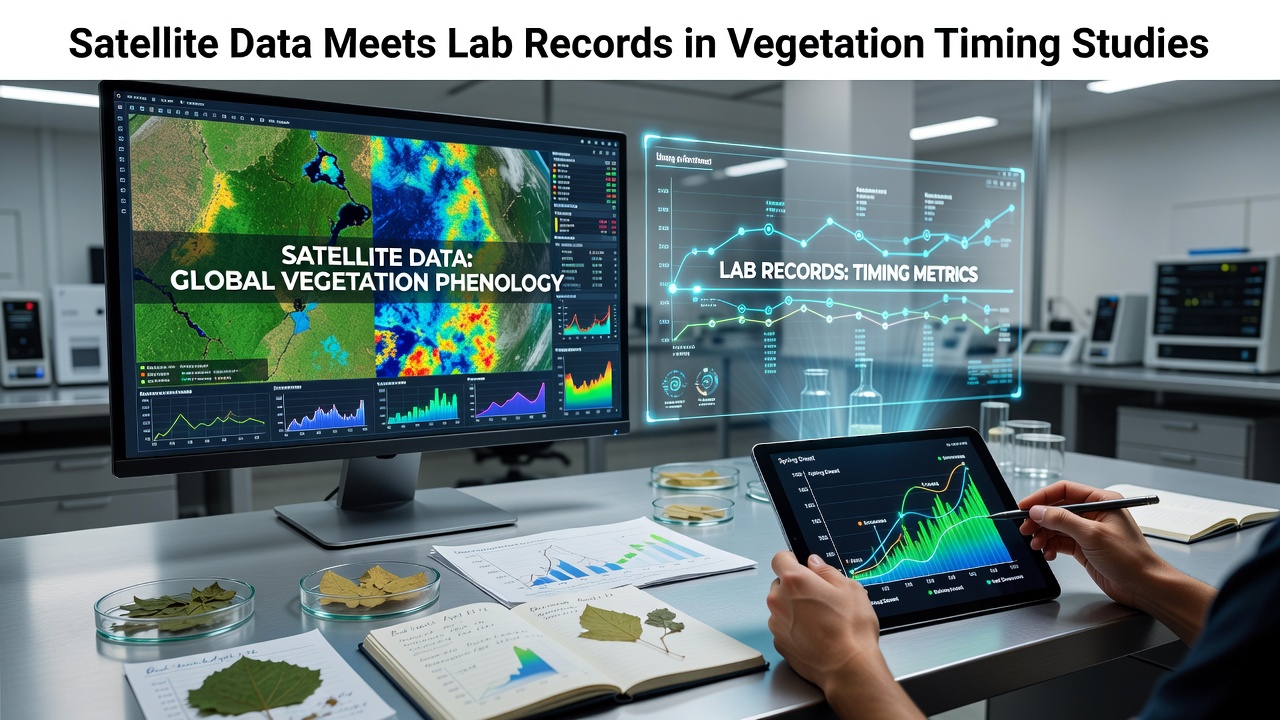
Vegetation timing studies track when plants leaf out, flower, and senesce across seasons, and researchers combine satellite observations with laboratory records to build precise phenological datasets. Satellite platforms such as MODIS and Landsat supply repeated measurements of normalized difference vegetation index values over large areas, while lab records from controlled experiments provide species-level data on temperature thresholds and photoperiod responses that satellites cannot resolve alone.
Integration begins when scientists align ground-based timestamps with pixel-level reflectance curves, and this process allows models to distinguish between different plant functional types even when canopy density varies. Data from the European Space Agency's Sentinel-2 mission, for example, offers 10-meter resolution that matches the scale of many field plots, reducing the mismatch between orbital passes and on-site sampling dates.
Ground Calibration Strengthens Orbital Signals
Laboratory records document exact dates when buds break or leaves expand under known temperature regimes, and these observations calibrate algorithms that interpret satellite green-up anomalies. Researchers at several universities have cross-referenced multi-year herbarium specimens with concurrent NDVI time series, revealing consistent lags between canopy-level signals and individual species events that vary by latitude and elevation.
One study coordinated by Australian institutions used growth chambers to expose seedlings to incremental warming scenarios while Sentinel imagery captured regional trends, and the paired datasets improved predictions of autumn leaf-drop timing by nearly three weeks compared with satellite-only models. Such calibration also helps separate drought stress from normal seasonal decline, because lab measurements quantify stomatal closure thresholds that satellites detect indirectly through changes in short-wave infrared bands.
Regional Patterns Emerge from Combined Datasets
Across the northern hemisphere, satellite-derived start-of-season maps now incorporate corrections derived from thousands of laboratory growth records, and the resulting layers show earlier green-up in urban heat islands compared with surrounding rural zones. In October 2026, an international working group released an updated pan-European phenology product that merged Copernicus satellite archives with standardized lab protocols from 14 countries, and the dataset documented a 1.8-day-per-decade advance in spring onset since 2000.
Observers note that similar efforts in Canada pair FluxNet tower measurements with laboratory chilling requirement experiments, allowing models to forecast when cumulative degree-days will trigger bud burst across boreal forests. These combined approaches also track invasive species spread because lab records establish distinct phenological signatures that differ from native vegetation cycles captured by satellites.
Challenges in Temporal and Spatial Alignment
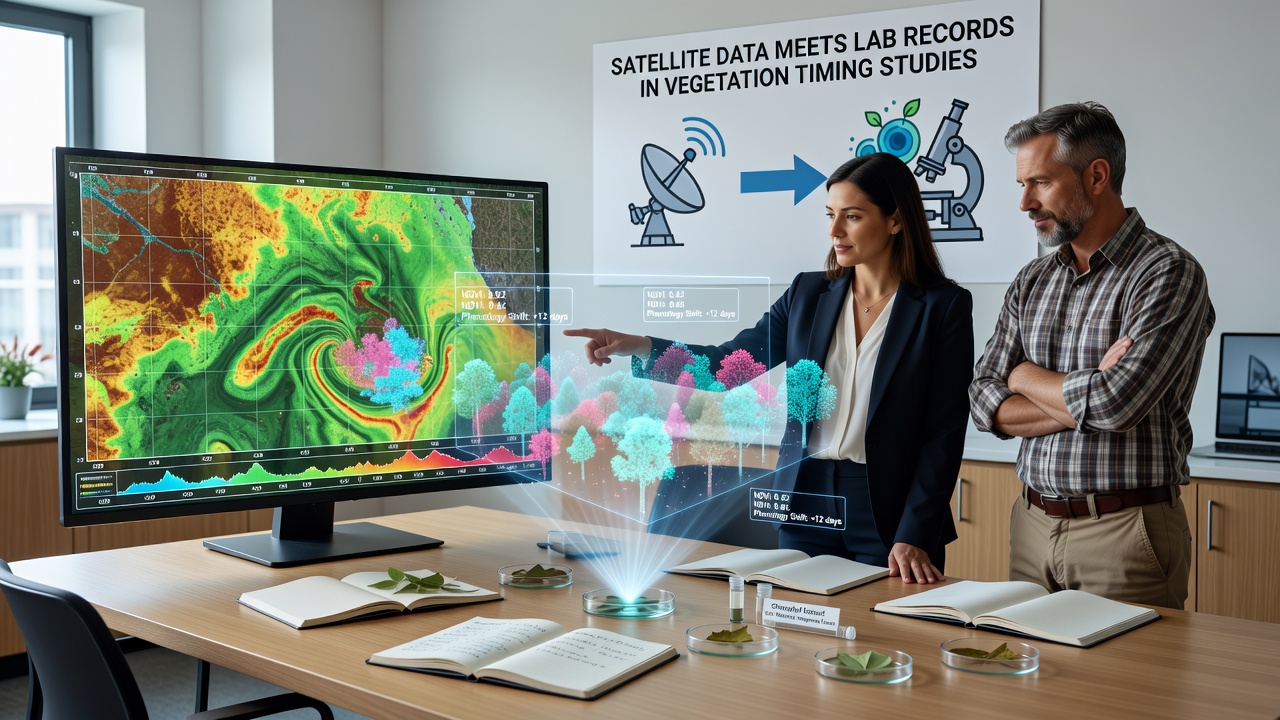
Cloud cover frequently interrupts satellite sequences, so researchers fill gaps using lab-derived interpolation functions that estimate missing green-up dates from temperature and photoperiod inputs. Spatial heterogeneity within a single satellite pixel can still obscure understory events, yet laboratory measurements of shade-tolerant species supply correction factors that improve sub-pixel accuracy when applied regionally.
Another persistent issue arises from sensor drift over time, and ongoing cross-calibration campaigns compare new orbital data against historical lab archives to maintain continuity. Teams at the United States Geological Survey maintain open repositories that pair Landsat collections with digitized herbarium phenology cards, and these resources support long-term trend analyses without requiring new field campaigns.
Applications in Agriculture and Conservation Planning
Farmers receive satellite alerts adjusted by laboratory phenological models that predict optimal harvest windows for specific cultivars, and conservation managers use the same fused datasets to schedule prescribed burns when invasive grasses reach peak flammability. In Australia, government agencies link MODIS-derived pasture greenness with controlled-environment trials that measure root allocation under varying rainfall, and the outputs guide grazing rotations that maintain soil carbon stocks.
European forestry programs apply similar methods to anticipate when deciduous stands will drop leaves, allowing harvest schedules that minimize soil compaction during wet periods. These operational uses demonstrate how laboratory precision scales to landscape decisions once satellite coverage supplies the spatial context.
Conclusion
Combining satellite data with laboratory records produces vegetation timing products that neither source achieves independently, and ongoing refinements continue to narrow uncertainties in both spatial distribution and species-level responses. As archives lengthen and sensor resolutions improve, the merged datasets support increasingly detailed forecasts for ecosystems under changing climate conditions.